Generative + Predictive + RPA
Three pillars—Generative, Predictive, RPA—stacked in 90-day sprints to turn AI hype into hard ROI. From 200 % content lift to 80 % faster invoices, this playbook maps tools, KPIs, and real-world wins into an EOS® framework you can deploy tomorrow.

The Three-Pillar Framework that Turns AI Hype into Hard ROI
Cold-Open – The Day Three “AI Gurus” Walked into a Plant
Mid-market manufacturer, 142 employees, scrap rate creeping above 4 %.
Monday, 8:40 a.m.—the demo gauntlet.
- Generative Guy shows a chatbot that spits slick work-order summaries.
- Predictive Gal waves charts forecasting machine failures “with 99 % accuracy.”
- RPA Bro promises bots that auto-reorder bearings before lunch.
The founder looks dazzled, the plant manager looks terrified, and the Integrator (that’s you) whispers:
“What if they’re all right—just not all at once?”
This post is your roadmap for stacking the three pillars—Generative, Predictive, RPA—so you hit value in 90-day chunks instead of funding a Frankenstein.
1 — Why Pillars Matter
Shiny-Object Syndrome kills more pilots than bad code.
Gartner pegs stall-out rates near 80 %—mostly cultural, not technical. A simple “pillar filter” slices hype from priority:
Scene-setter. After three weeks of “AI demo roulette,” the leadership team was dizzy. One consultant painted word-pictures about chatbots that write SOPs, another promised crystal-ball forecasts, and a third swore robots would click every button by Friday. The founder finally asked the Integrator a hard question:
“If each pitch is ‘the answer,’ how do we know which one comes first?”
That’s when Lauren (our Integrator-hero) slid a notepad across the table. She drew three boxes, labelled them Generative, Predictive, and RPA, and wrote a single question under each. The room went quiet—because suddenly the chaos had shape.
Below is the same napkin sketch, cleaned up. Use it to sanity-check every new AI idea that walks through your door.
| Pillar | Core Question | Typical Output |
|---|---|---|
| Generative | “What can we create or capture faster?” | Docs, code, slide decks, images |
| Predictive | “What can we see coming before it smacks us?” | Forecasts, anomaly alerts, churn scores |
| RPA | “What can we execute without human drag?” | Auto-approvals, data entry, API robots |
Stack them—capture → foresee → automate—and you compound value instead of compounding chaos.
2 — Pillar #1 — Generative
Creation & Knowledge Capture Layer (Weeks 0-4)
2.1 What It Is
Large-language or diffusion models that draft text, code, images, slides—so humans spend brain cycles on strategy, not keystrokes.
2.2 EOS®-Friendly KPIs The Metrics That Killed the Debate
By day-four the new copy fire-hose was blasting pages onto the CMS, but the CFO still wasn’t sold.
“Show me numbers,” she said, “or show me the kill-switch.”
Lauren —the Integrator—tightened her ponytail, grabbed the Scorecard, and did what Integrators do: turned fuzzy excitement into sharp accountability. She wrote three lines on the whiteboard:
Docs shipped Manual minutes on content Proposal turnaround time
Then she circled them and added, “These hit green, Generative stays. They don’t, we pull the plug.”
That three-circle sketch became the KPI set below—EOS-friendly because they publish to the Scorecard every Friday and tell the story in ten seconds flat.
- Docs shipped / week
- Manual minutes on content
- Proposal turnaround time
2.3 Case Study · SaaS Content Ops

Scene-Setter · The Content Bottleneck That Almost Tanked Q2
SaaS company StreamFrame was the definition of “product-led growth”—except the product blog hadn’t published in thirteen days. Marketing’s Trello board showed 47 half-written posts, one exhausted copywriter, and a CMO who’d promised Sales “three net-new posts a week, minimum.”
Every Tuesday the founder opened the Level 10® and asked the same question:
“Why does the feature ship faster than the blog about the feature?”
The real answer was ugly math:
- Average draft time: 6 h (research, SME interview, two rewrites)
- Copywriter bandwidth: 30 h/wk
- Required posts to hit SQL target: 24/mo
Do the math and you get 144 h of writing for 120 h of capacity—before fire drills. Something had to bend.
Enter Pillar One—Generative. Lauren (our Integrator) didn’t start by buying shiny tools; she spent one afternoon building a style prompt that captured StreamFrame’s voice: friendly, mid-technical, 150-word intros, metaphor in paragraph two, CTA in the outro. She fed that prompt to ChatGPT Pro and Claude 4 as “writers #2 and #3.”
Within a week the backlog flipped: drafts flowed faster than reviews, copywriter morale spiked, and the CMO finally walked into the Level 10® with numbers that made Sales smile.
That set the stage for the metrics you’re about to see:
| Metric | Before | After 90 d | Δ |
|---|---|---|---|
| Blog posts / month | 12 | 36 | (+200 %) |
| SQLs / month | 94 | 129 | (+37 %) |
| Content budget | $7.2 k | $5.1 k | (-29 %) |
CMO quote:
“Generative let writers write and strategists strategize. Posts now ship faster than approvals.”
Lauren had her proof on the Scorecard—docs tripled, budget shrank—and the once-skeptical CFO finally nodded. Momentum was real, but fragile. If other teams were going to replicate the win without flooding Slack with “How do I prompt this thing?” questions, they needed guardrails.
So before clocking out on Day-30, Lauren wrote a one-pager titled “Generative Quick-Start.” It wasn’t a manifesto; it was a pit-crew checklist: pick one lane, lock a style prompt, sandbox safely, measure in days—not quarters. She taped it above the coffee machine. By Monday, product, HR, and even Legal had copied the sheet.
Use the same five-step cheat-sheet below to lock in your own Generative pillar.
(And yes—once you run this playbook, we’re done with Pillar One and ready to aim the headlights at Predictive.)
2.4 Quick-Start Playbook
- Pick one lane—marketing copy, code comments, or SOP drafts.
- Create a “Style Prompt” doc—tone, length, jargon.
- Pilot in a sandbox (ChatGPT Pro + Claude 4).
- KPI live by Day 5—“manual minutes on copy.”
- IDS™ fears (“plagiarism!”) in week-one Level 10®.
3 — Pillar #2 — Predictive
Foresight Layer (Weeks 5-10)
3.1 What It Is
Models that forecast demand, flag anomalies, or score churn using patterns humans miss.
3.2 EOS®-Friendly KPIs — Spotting Trouble Before It Sparks
Friday morning, Week 6. The plant floor hummed, but the mood in the war-room didn’t. A month into the generative win, the founder still heard hiss-whispers about “witch-doctor dashboards.” Lauren printed three graphs on a single sheet and slid it across the stainless-steel conference table:
- Forecast error — “If we’re wrong here, every other KPI is theater.”
- Scrap / defect rate — “Each extra point is money shredded and morale drained.”
- Lead-to-close velocity — “Sales loves fast quotes, Ops loves fewer re-runs.”
She looked at the skeptical maintenance chief and added, “If these three lines trend the right way, you won’t care what logo the model wears.”
The room nodded. Metrics (and donuts) calm fear better than slide decks.

3.3 Case Study · Midwest Plant
| Metric | Pre-AI | Post-AI 90 d | Δ |
|---|---|---|---|
| Scrap rate | 4.1 % | 2.9 % | (-1.2 pts) |
| Unplanned downtime | 54 h/qtr | 47 h/qtr | (-12 %) |
| Planner hours / wk | 23 | 11 | (-52 %) |
Plant Manager:
“We stopped guessing when machines would break. Maintenance shows up before the smoke.”
3.4 Quick-Start Playbook — Turning Charts into Action
The dashboards were glowing green, but Lauren knew the honeymoon fades fast. One late alert, one false positive, and everyone would blame “the algorithm” instead of dirty data. So she called the data lead and the maintenance chief into a dusty meeting room, slapped an index card on the table, and said:
“Five steps. If we can’t explain Predictive in fewer than 200 words, we’re not ready for robots.”
They scribbled, argued over step order, and stopped when the plant’s break-siren blared. The card became the laminated cheat-sheet below. It still hangs in the planner’s cubicle.
Use it to lock in your Predictive pillar. Once these five boxes are checked, you’re cleared to unleash RPA in Act IV.
- Choose one North-Star KPI—scrap, churn, or renewal risk.
- Centralize a clean history—dirty data = no crystal ball.
- Prototype in notebooks (OpenAI API or Vertex).
- Set an alert threshold—model pings Slack first, not the plant manager’s phone at 2 a.m.
- Review drift on Day 70 with your fractional CAIO; tweak or retrain.
Predictive pillar locked? Good. Grab a coffee—automation season starts next.
4 — Pillar #3 — RPA / Autonomous Action
Do-The-Work Layer (Weeks 11-14)

4.1 What It Is
Robotic-process workflows (think UiPath, n8n, Zapier) that click, type, and API-call while humans sleep.
4.2 EOS®-Friendly KPIs — Proving Bots Aren’t Just Clicking in the Dark
By Week 11 the finance team had a UiPath bot quietly keying invoices at 2 a.m., but skepticism lingered. The Controller still printed every summary report and circled outliers with a red pen. Lauren knew “look how fast it types” wouldn’t sway a CFO, so she pinned three metrics to the Scorecard and promised green in thirty days—or she’d yank the bot’s plug herself.
- Touch-time hours
- Invoice cycle time
- “Where’s my invoice?” emails
“Kill these three pain points,” she told the Controller, “and the bot gets tenure.”
Numbers talk; eye-rolling stops.
The KPIs were on the board, but numbers alone don’t shift belief—stories do.
So Lauren walked the CFO down to Accounts Payable, where two analysts were still triple-checking invoices against shipping docs.
“Watch this,” she said, triggering the bot’s overnight log.
Line after line flashed: 78 s… 81 s… 79 s.
The analysts stared, then laughed—because 14-minute keystroke marathons had just shrunk to coffee-sipping time.
With that hallway demo, the CFO stopped asking if RPA was real and started asking how soon it could eat the rest of month-end close.
Here’s the before-and-after that sealed the deal:
4.3 Case Study · Finance Back-Office
| Metric | Before | 60 d After | Δ |
|---|---|---|---|
| Invoice cycle | 14 min | 78 sec | (-80 %) |
| EBITDA run-rate | 6 % | 8 % | (+2 pts) |
| “Where’s my invoice?” emails | 112/mo | 9/mo |
Controller:
“Bots handle the boring. Analysts chase fraud. Everybody wins.”
4.4 Quick-Start Playbook — Putting the Wrench in RPA
The first night the bot ran, it mislabeled two vendor IDs and the Slack channel lit up like a slot machine. Instead of panicking, Lauren walked Ops through the same checklist she’d taped above the coffee machine after Generative and Predictive went live. Five boxes, one laminated card, twenty minutes of calm.
Use her “pit-lane” list below. If every check marks green, your RPA pillar is road-ready. Miss one, and you’re handing a toddler the car keys.
- Harvest a low-code win—invoices, HR onboarding, IT tickets.
- Add audit logging on Day 1 (Supabase or Google Sheet).
- Set an emergency kill-switch—Ops pauses the bot without calling IT.
- Tie bot runs to the Scorecard—touch-time hours should fall weekly.
- Celebrate the first green metric in Headlines—bots earn trust by saving minutes, not by giving TED Talks.
RPA box checked? Congrats: all three pillars are stacked. Next quarter is about compounding, not convincing.
5 — How to Stack the Layers (Your 90-Day Track Map)
Lauren liked to doodle race tracks, so she sketched three colored lanes on a legal pad. She slid the sketch to the founder and said, “Drive the blue lane first, then green, then red—your AI journey is a relay, not a drag race.”
| Lap | Pillar | “Why Now?” | Ownership | Budget Band* |
|---|---|---|---|---|
| 0 – 4 w | Generative | Win hearts & eyeballs | Content Lead | $ 20 – $ 250 |
| 5 – 10 w | Predictive | Turn hindsight → foresight | Data / CAIO | $ 2 k – $ 10 k |
| 11 – 14 w | RPA | Automate what the model forecasts | Ops Process Owner | $ 25 – $ 1 k |
*Typical SaaS seat & infrastructure spend per 90-day Rock.
Why this order?
- Generative earns immediate trust—everyone sees drafts ship faster.
- Predictive needs clean logs—Generative already wiped typos and duplicate rows.
- RPA only clicks what Predictive flags—no toddler-with-chainsaw moments.
5.1 The Layer-Cake Litmus – Why Order Beats Ambition
Lauren knew a single Gantt chart could spark civil war, so she stole five minutes at the whiteboard during the Tuesday L10®. She drew three colored lanes—blue, green, red—then added tick-marks for the next 14 weeks.
| WEEKS 0 – 4 | WEEKS 5 – 10 | WEEKS 11 – 14 |
|---|---|---|
| Generative | Predictive | RPA |
Stack the pillars left-to-right—cause, not tools.
“Imagine we’re baking a layer cake,” she said, capping the marker. “Blue is the sponge—light, fast, Generative. Green is the frosting—Predictive insights spread on top. Red is the fondant—RPA seals the deal so we can stack another tier next quarter. Try to flip that order and you’ll serve raw batter or crack the cake in half.”
The founder squinted, then grinned. The room relaxed; everyone finally saw when each pillar should happen, not just what it could do.
That napkin sketch became the timeline below—your quick-glance test for every new AI idea that walks through the door. If someone pitches RPA before data is flowing, point them to the missing layer and move on.
- Did we publish a Generative win in Headlines this week?
- Did the Predictive alert fire before the crisis?
- Did a bot close at least one ticket while humans slept?
If the answer to any Post-it was “no,” that lane stayed yellow. Only when all three turned green did she schedule the next quarter’s moon-shot.
6 — Score Yourself Before You Wreck Yourself
Thursday afternoon the plant floor smelled like coolant and victory, but Lauren had seen too many projects celebrate early. She remembered a metal-fab client who “felt ready” and still face-planted because no one could say how ready in numbers.
So she grabbed a seltzer, opened a fresh Google Sheet, and slapped three slider bars across the top—0 to 15 for Generative, Predictive, and RPA.
At 4 p.m. she pinged the exec Slack channel:
“🟢 5-min favor: rate our three pillars—no names on the sheet, honesty wins beers.”
By 4:12 every row was filled. The averages told a painful truth:
- Generative = 13 (solid)
- Predictive = 9 (wobbly)
- RPA = 4 (dreamland)
Lauren screenshotted the chart, dropped it into the Level 10® deck, and typed a single caption:
“Let’s crawl before we sprint.”
That anonymous pulse check became a quarterly ritual—half guardrail, half brag-sheet. Try it with your own team before betting head-count on the next AI headline.
| Pillar | 0–5 pts | 6–10 pts | 11–15 pts |
|---|---|---|---|
| Generative | No prompt SOP | Pilot drafts, heavy edits | 80 % content AI-assisted |
| Predictive | Dirty data graveyard | Clean data, model idle | Alerts drive weekly action |
| RPA | All manual clicks | One bot in QA | Bots handle ≥ 30 % tickets |
Totals:
0-15 pts = Crawl | 16-30 pts = Jog | 31-45 pts = Sprint
“Call me when we’re Jogging,” the founder joked. They hit 34 the next quarter.
7 — EOS® Motion Map (Where Each Pillar Plugs In)
By this point the founder was sold on the three pillars, but the EOS Implementer still had one eyebrow raised.
“Love the cake. Show me where it lives inside the EOS house.”
Lauren grabbed a fresh sheet, drew the EOS hexagon, and wrote one pillar inside every component.
“AI isn’t an add-on,” she said, circling the diagram. “It’s the motor we drop into the chassis you already trust.”
Below is the same “house diagram” in table form—so you can see, at a glance, how Generative, Predictive, and RPA bolt directly onto Vision, People, Data, Issues, Process, and Traction.
| 🏠 Where Each Pillar Lives in the EOS® House | |
|---|---|
| Vision | Generative (Claude) condenses the 10-Year & 3-Year Picture into a Slack pin everyone sees daily. |
| People | RPA frees staff from keystroke toil; GWC talks move brains to their genius zones. |
| Data | Predictive enforces a single source of truth—dirty tables throw model errors fast. |
| Issues | Generative drafts root-cause ladders for IDS™ so teams solve the real problem quicker. |
| Process | RPA bots embed screenshots into SOPs and attach audit logs—auditors now smile. |
| Traction | Scorecard pulls manual hours saved & model-assist % straight from Supabase every Friday. |
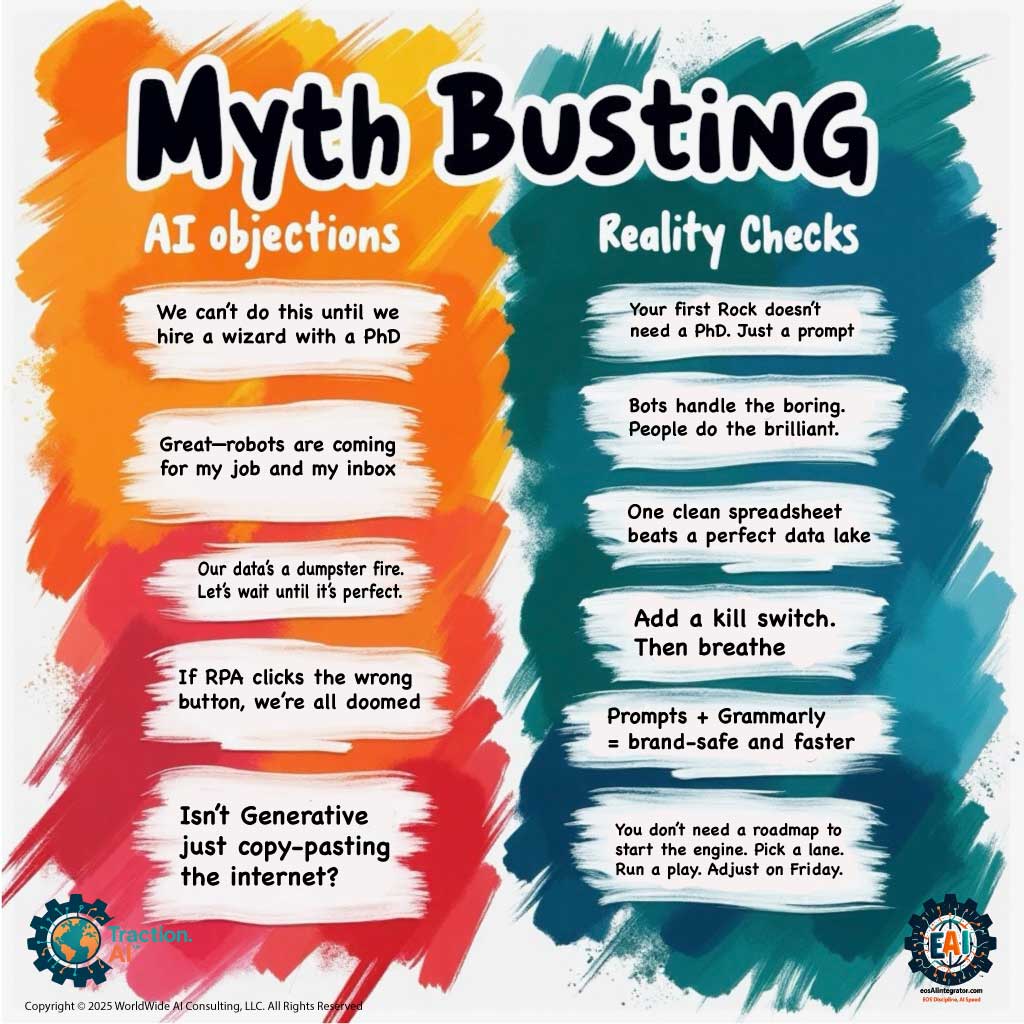
8 — Objections & Myth-Busting (Because Someone Will Ask)
Friday wrap-up, 4:55 p.m.
The plant floor was finally quiet, but the leadership Zoom was the opposite. A red-eyed engineer un-muted first:
“Love the win-rates, Lauren, but don’t we need a whole data-science team before we push further?”
That cracked open the floodgate of classic AI objections. Lauren parked her slide deck, took a sip of cold coffee, and fielded them one by one.
| Myth in the Wild | Reality Check |
|---|---|
| “We need data scientists first.” | Nope. Your first Generative Rock ships with zero code and funds the data lake. |
| “RPA will steal jobs.” | Finance case proved the opposite—analysts were promoted to fraud-hunter roles. |
| “Multiple LLMs will confuse staff.” | One Golden Rule fixes it: ChatGPT for creative bursts, Claude for context carry-over. |
| “Predictive models are crystal balls.” | Drift flagged on Day 70, retrained in two hours—models behave like living SOPs. |
| “Generative content equals plagiarism.” | Style-prompt + Grammarly scan clocks 98 % original—safer than most human drafts. |
Lauren ended the call with a smile:
“Keep the myths coming; the scoreboard loves a good villain.”
Objections handled, the team hit “Leave Meeting.” Monday would be RPA’s first full sprint.
9 — The 48-Hour Lightning Pivot (All Three Pillars Under Fire)
Day 0 — 07:00
Lauren’s phone buzzes mid-latte: a VentureBeat alert. Competitor X has launched a free tier that slices StreamFrame’s entry-level pricing in half. Slack blows up. Sales predicts a 5 % churn spike by Monday.
Lauren opens a war-room Zoom, empties her coffee, and lines up the three pillars like dominoes.
The 3-Pillar Play in Real Time
| Pillar | Favorite Tools | Starter KPI |
|---|---|---|
| Generative | ChatGPT Pro, Claude 4, Gamma, Adobe Firefly | Manual minutes on content |
| Predictive | OpenAI fine-tunes, TimescaleDB, Supabase | Forecast error % |
| RPA | n8n Cloud, UiPath, Zapier | Touch-time hours / task |
Pro tip: add Model Assist %—how often humans accept AI suggestions. Trust in math, measured weekly.
Day 2 — 16:00 Dashboard
| Metric | Before Pivot | 48 h After | Δ |
|---|---|---|---|
| Churn risk projection | 5 % | 1.7 % | −66 % |
| ARR at risk | $547 k | $235 k | $312 k saved |
| CS “panic” tickets | 41 | 7 | morale ↑ |
CFO (donut in hand):
“AI just bought us a quarter-million dollars and the weekend. Keep baking that cake.”
Lauren smiles, shuts her laptop, and finally warms her coffee—bot-brewed, of course.
Next quarter’s moon-shot? Turning those credit-offer click logs into a self-optimizing retention engine—but that’s a story for another Friday.
10 — Toolkit & KPI Cheat-Sheet
Lauren’s Slack lit up the moment the pivot dust settled:
“Cool stories,” the RevOps lead typed, “but what tools do we actually buy—and what number proves each one works?”
Fair ask. A toolbox without gauges is a junk drawer.
So Lauren opened Notion, created a three-row table—one row per pillar—and dropped in the exact tools that earned green lights, plus the starter KPI that shut down arguments in less than a sprint.
She pinned the table under the #ai-playbooks channel with a simple rule:
“Pick one tool, track one metric, share the win on Friday.”
By the next Level 10® the board looked like a bookshelf: every tool had an owner, every owner had a number.
Here’s the same cheat-sheet for you—no hunting required.
| Pillar | Favorite Tools | Starter KPI |
|---|---|---|
| Generative | ChatGPT Pro, Claude 4, Gamma, Adobe Firefly | Manual minutes on content |
| Predictive | OpenAI fine-tunes, TimescaleDB, Supabase | Forecast error % |
| RPA | n8n Cloud, UiPath, Zapier | Touch-time hours / task |
Pro tip: add Model Assist %—how often humans accept AI suggestions. Trust in math, measured weekly.
Pick your pillar, grab a tool, track one number, and you’re out of the storytelling business and into scoreboard mode.
11 — Ready to Pick Your Pillar?
Lauren ended the all-hands with a final slide—no charts, just a big blue download button:
“Choose one pillar, score yourself, set a Rock. Everything else is commentary.”
The room went quiet, then laptops flipped open. The scorecard she shared is the same one below—nine yes/no questions that auto-grade you into Crawl ⬩ Jog ⬩ Sprint. One sheet, three minutes, instant clarity.
📊 Get the 3-Pillar Scorecard + Complete Implementation System
This scorecard is the foundation of our proven framework:
- ✅ 3-Pillar Scorecard (featured in this post)
- ✅ Auto-tier Grading: Crawl → Jog → Sprint
- ✅ 90-Day Implementation Roadmap
- ✅ All Templates + ROI Calculator
- ✅ Real Case Studies with Metrics
How to use it tonight
- Run it solo—score yourself before the politics start.
- Share it in Slack—ask each leader to drop their numbers by morning.
- Average the scores—that’s your true readiness tier.
- Set one 90-day Rock that matches the lowest pillar. (Crawl first, sprint later.)
Next quarter, run the same sheet; watch green bars replace yellow. That’s traction you can print, frame, and pin above the coffee machine.
Next on Traction.AI
7/11 Prompt Engineering for Busy Integrators
7/24 will be next AI Toolbox Thursday: Data & Dashboards in an EOS World: Scorecards (Ninety) vs BI Engines (Superset | Metabase | Looker)
Hit Subscribe so it lands before your coffee kicks in. ☕️🔧
AI Speed | EOS® Discipline
See you on the track. 🏁
© 2025 WorldWide AI Consulting LLC + Traction.AI • Built on Ghost
Comments ()